
Our financials 2025
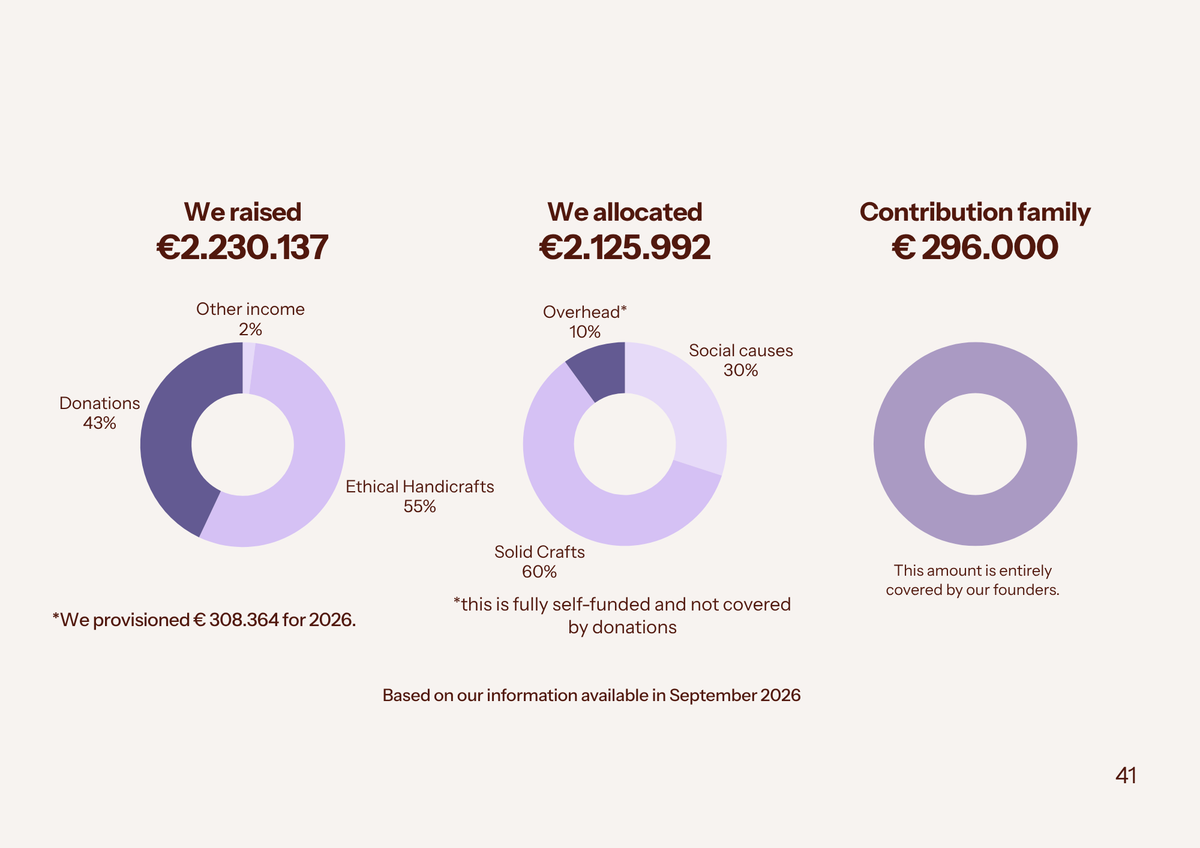
Every contribution matters—and so does how it's spent. Our 2025 financial overview gives a clear and honest picture of how we allocate resources to create lasting change. By sharing our financials openly, we invite you to see not just the numbers, but the values behind them.
In 2025
Solid Group
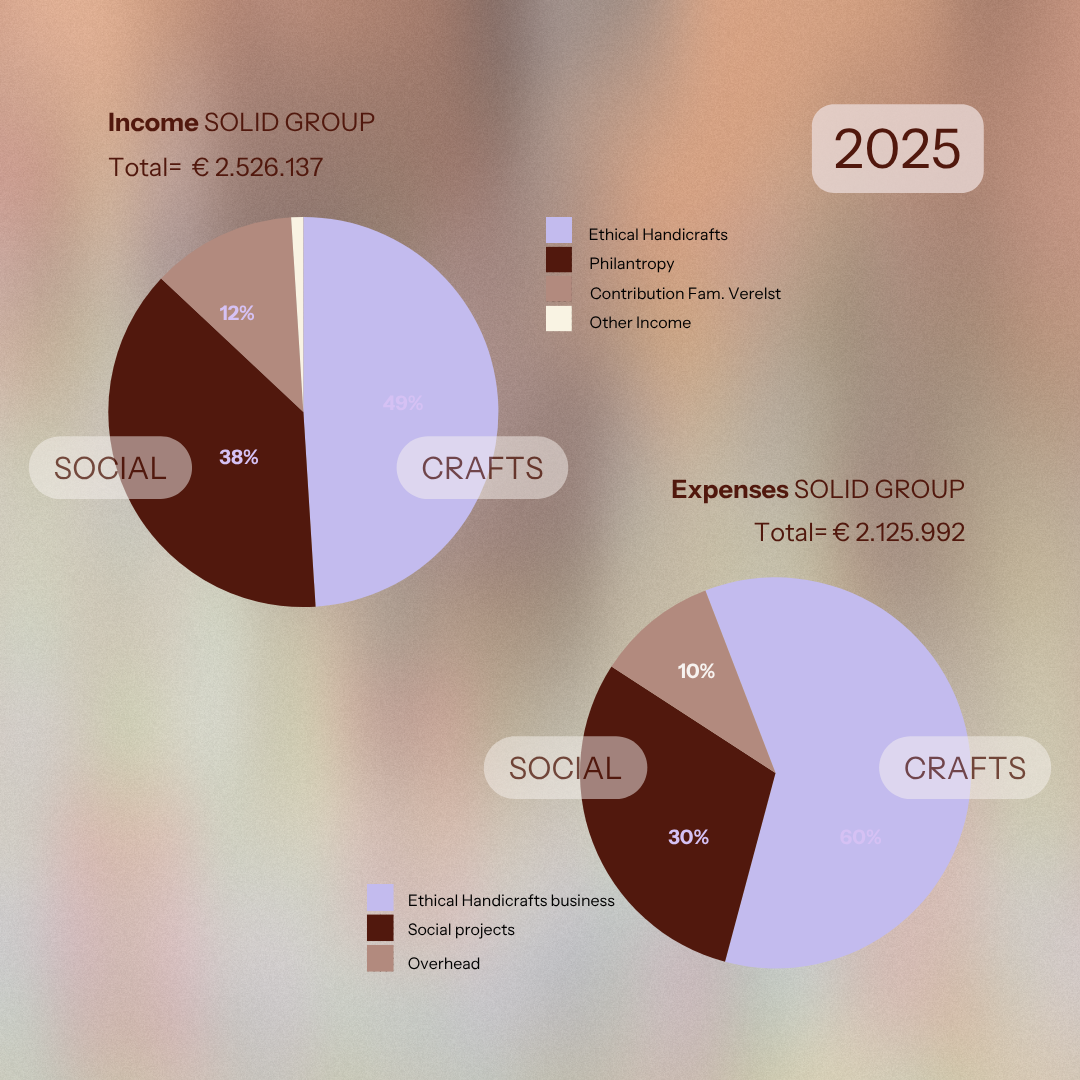
Solid Group brings together our social business and our social projects. In 2025, our income was split almost evenly between Solid Crafts and philanthropic support. The business accounted for around 60% of spending, and about a third went directly to social projects.
Social business in action
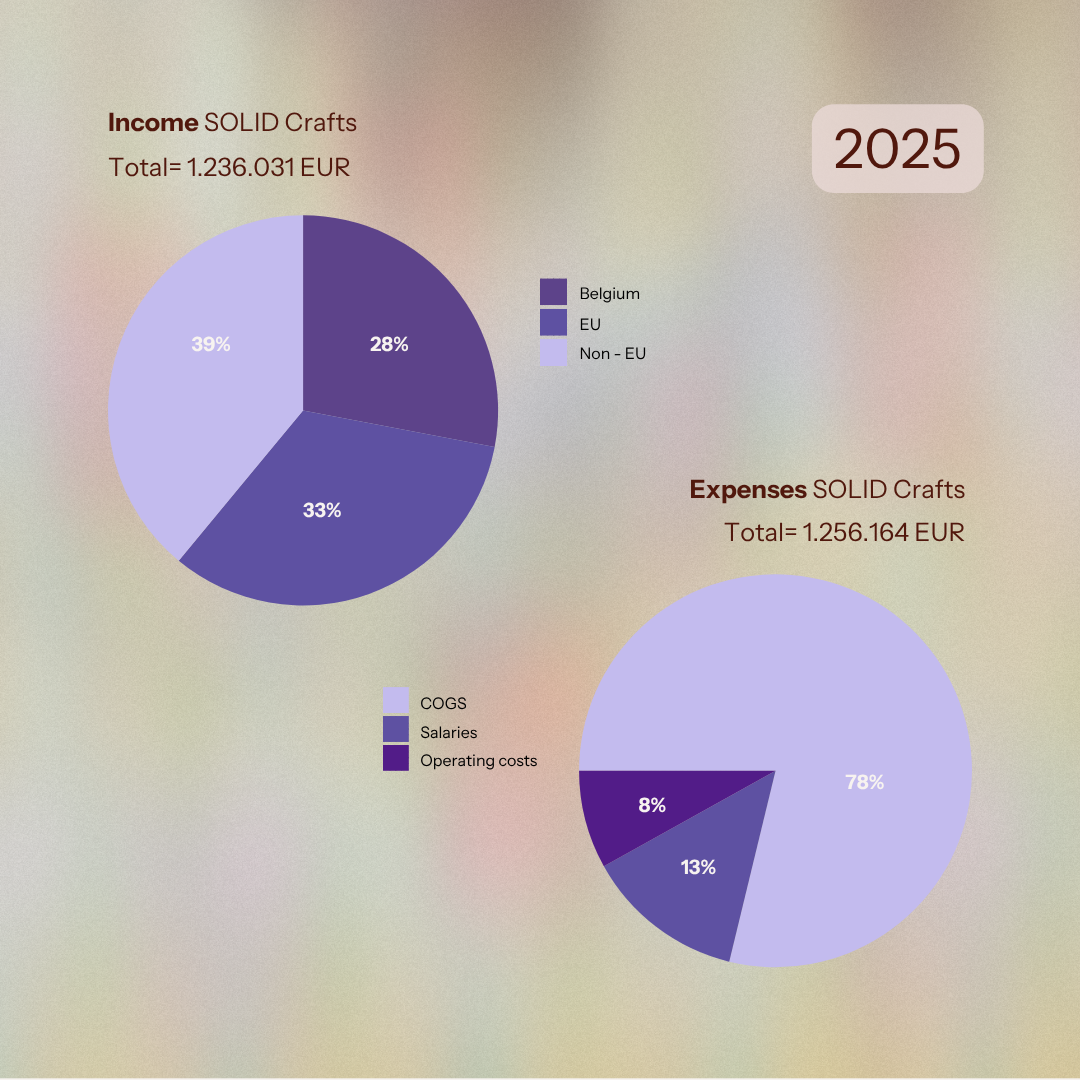
Solid Crafts is the business side of our model, creating fair jobs for underprivileged women in Peru and Kenya. In 2025, it broke even with a small surplus. Over 70% of our sales came from outside Belgium, and more than three quarters of spending went into production. Every euro invested is meant to grow, so business success can fund lasting social change.
Funding Our Social Projects
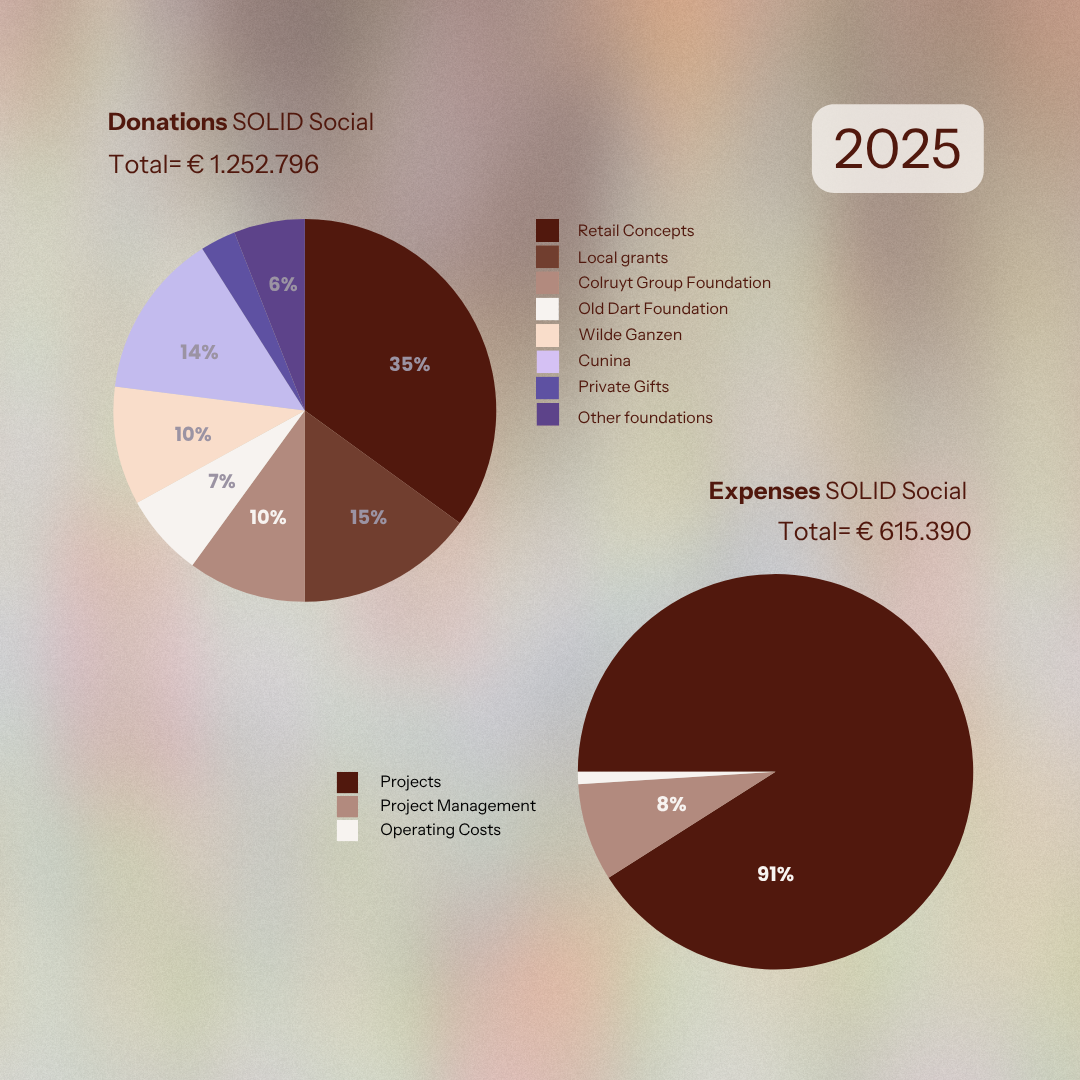
Our social projects are funded primarily through donations, with around 70% of our donors based in Belgium. Most contributions are tied to specific initiatives, supporting vital work in areas like education, healthcare, and community development.
Only a small percentage of funds goes to project management and operating costs—carefully kept to a minimum, yet essential to ensure quality, transparency, and long-term impact. Every euro is used with care to maximize its value for the communities we serve.
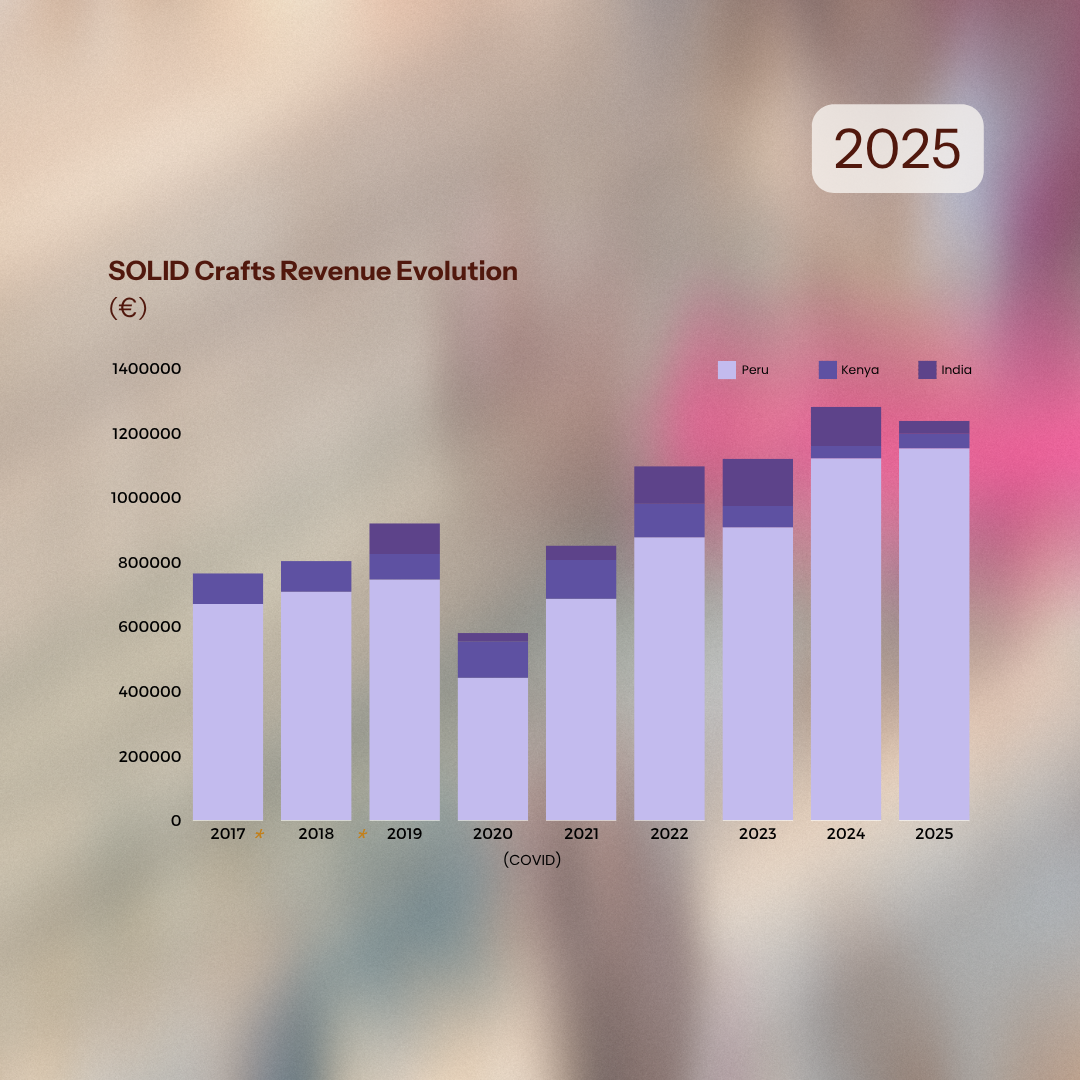
Steady growth
Since our founding in 2017, we've achieved 54% growth over five years, with particularly strong momentum in 2022. This was driven by our B2C brand TalesBySolid, which expanded our consumer reach. However, due to high operational costs, we strategically shifted focus to our more sustainable B2B model at the end of 2023.
*Please note that figures reported reflect only revenue generated in Belgium. Sales figures from Peru and detailed breakdowns from 2017-2018 are not included in these numbers.

Where your donations go
This graph shows how donations are distributed across our social projects. 95% of the funds currently go to Peru, where the social part of our work is the most developed and has the largest impact. A smaller share supports our growing initiatives in India and Kenya.